Today, data centres are among the fastest growing electricity consumers worldwide and therefore one of the key levers for the energy transition in the digital age. As early as 2023, their global electricity demand was between 300 and 380 terawatt hours (TWh), equivalent to 1 to 1.3% of global consumption. By 2030, the International Energy Agency (IEA) expects this to almost double to around 945 TWh – driven by the increasing use of artificial intelligence and data-intensive applications. The industry is therefore faced with a double challenge: reducing energy use while meeting rising demand.
With the increasing demand for electricity, the requirements for energy efficiency in data centres are becoming much more stringent. Electricity can account for up to 60% of a data centre’s operating costs (OPEX), while investors and customers are increasingly demanding credible ESG strategies. In addition, regulators such as the EU are making efficiency metrics mandatory.
PUE (Power Usage Effectiveness) is the globally recognised standard for comparing the energy efficiency of data centres. It shows how much of the energy consumed is actually used for IT and how much is used for supporting infrastructures such as cooling, uninterruptible power supply (UPS), lighting or security. The value of PUE for data centres lies in its simplicity:
The PUE was introduced in 2007 by The Green Grid consortium with the aim of making energy efficiency uniformly measurable worldwide. It is now firmly embedded in international standards:
These standards also define measurement methods, measuring points and quality requirements.
PUE reflects only the ratio of energy flows within a data centre. In other words, the PUE shows how much of the energy absorbed is actually used for IT systems. However, this is precisely where its limitation lies: the PUE value says nothing about the actual computing performance, the climate impact of the electricity used, or the resource consumption of the cooling technologies in the data centre.
To address these gaps, three supplementary key figures are commonly used in practice:
These metrics are becoming increasingly important, especially in the context of ESG strategies, carbon footprint reporting, and regulatory reporting obligations They elevate PUE from an isolated efficiency indicator to a component of holistic sustainability monitoring.
How can the PUE value be calculated?
The calculation of PUE follows a simple principle, but the underlying measurement methodology is differentiated and standard-based. The decisive factor is the demarcation between the power consumption of the IT systems and the total consumption of the entire data centre.
The formula for the PUE is:
.png?width=540&height=75&name=Blog_PUE_Formel_Rechenzentrum_EN%20(002).png)
This formula is simple, yet revealing. An ideal PUE of 1.0 in a data centre means that all the energy consumed flows directly to the IT systems – not a single watt is lost to air conditioning or other infrastructure. Technically, this ideal is unattainable; it serves only as a theoretical benchmark.
Total Energy Consumption (Metre):
Includes all systems required to maintain IT operations, such as:
- Cooling systems (air cooling, liquid cooling, adiabatic systems, etc.)
- Losses in UPS systems and transformers
- Lighting
- Access control, fire protection, security technology
This formula is simple, yet revealing. An ideal PUE of 1.0 in a data centre means that all the energy consumed flows directly to the IT systems – not a single watt is lost to air conditioning or other infrastructure. Technically, this ideal is unattainable; it serves only as a theoretical benchmark.
IT load (denominator):
Includes only systems that provide direct IT services, such as:
- Servers
- Storage systems
- Network components
- KVM switches
- Monitors and IT consoles
Example calculation:
A data centre consumes 1,000,000 kWh annually for IT and a total of 2,000,000 kWh of electricity. PUE = 2,000,000 / 1,000,000 = 2.0. This means that only 50% of the energy is effectively used for IT, while the remainder is consumed by supporting infrastructure.
Measurement methods of PUE according to ISO/IEC 30134-2
The significance of a PUE value depends largely on the measurement method chosen. The international standard ISO/IEC 30134-2 defines four levels for this purpose – depending on where the IT power consumption is recorded.
PUE0: The simplest variant is PUE0. There is no direct measurement here, but only an estimate based on empirical values or rough assumptions. This method is fast, but imprecise and is only suitable for initial assessments.
PUE1: PUE1 is based on measurements behind the uninterruptible power supply (UPS). This is the standard in many data centres, as the IT load can be easily recorded at this point. However, conversion losses or subordinate consumers are often not precisely delineated.
PUE2: A higher level of accuracy is provided by PUE2, where measurements are taken directly behind the Power Distribution Units (PDUs), i.e. at the point where the power is distributed to the server racks. This method provides much more realistic data, but requires finer instrumentation.
PUE3: PUE3 achieves the highest measurement quality. In this approach, energy is recorded directly at individual IT components, for example via rack-level metering or socket metres. This method is considered particularly precise, but is technically and organisationally complex.
For reliable comparisons, many standards require a year-round measurement – the so-called Trailing Twelve Months (TTM). This accounts for seasonal variations in cooling and energy demand. Short-term or project-specific evaluations are also possible, for example:
- iPUE (interim PUE): for temporary measurements
- pPUE (partial PUE): when only certain sub-areas, such as individual server rooms or racks, are to be considered.
Typical PUE values in practice
In practice, the PUE value fluctuates considerably, depending on the year of construction, technology, site conditions, and utilisation of a data centre. While modern hyperscalers achieve peak values, older medium-sized data centres are sometimes significantly higher.
|
Data Centre Type
|
Typical PUE value
|
Practice
|
|
Hyperscaler (Google, Microsoft)
|
1.08 – 1.20
|
Google (TTM-PUE: 1.09); Microsoft Design Goal: 1.12
|
|
Modern Colocation Providers
|
1.3 – 1.5
|
e.g. Equinix, Digital Realty, laut Uptime Institute
|
|
Midsize Data Centres
|
1.6 – 2.0
|
Often without free cooling, lower utilisation
|
|
Legacy Locations
|
> 2.5
|
With outdated infrastructure or low IT load
|
|
Locations in cold regions
|
≈ 1.1
|
e.g. in Nordic regions with free air cooling (airside economiser)
|
Factors influencing PUE practice values
Cooling strategy: Free cooling in cold regions can significantly improve PUE
IT utilisation: The better servers and storage are utilised, the lower the relative overhead
Economies of scale: Large data centres can systematically exploit efficiency potentials
Design standards: New data centres with hot aisle containment, optimised air flow, or liquid cooling achieve better PUE values
Why is the PUE value of a data centre important?
The PUE value is more than a technical indicator. It serves as a benchmark for energy efficiency, a business lever, a sustainability metric, and an increasingly important tool for regulatory compliance. For operators, investors, and customers, it is a central point of reference in the planning, operation and evaluation of a data centre.
Economic relevance
Energy efficiency has a direct impact on operating costs. A PUE of 1.6 means 60% additional energy for infrastructure. If the PUE falls to 1.4, this overhead is reduced by over 12%. For a 10 MW data centre, this corresponds to around 1.25 GWh of energy saved annually – with significant potential savings in electricity costs, cooling technology, and grid charges.
Example calculation:
- IT load: 10 MW
- PUE reduction: from 1.6 to 1.4
- Savings: 2 MW × 24/7 operation = 1.25 GWh/year
Why the PUE is gaining importance beyond technology
A low PUE not only reduces the energy consumption of a data centre, but also has a direct impact on the carbon footprint. In climate strategies such as the Science Based Targets or the EU Taxonomy (EU classification system for sustainable economic activities), the PUE has long served as an efficiency indicator that makes progress quantifiable. It also plays a central role in emissions reporting – for example, in the case of Scope 2 emissions (indirect emissions from purchased energy). Especially in countries with a high CO₂ factor in the electricity mix, such as Poland or Ireland, any PUE improvement significantly increases the climate impact.
Efficiency indicators become legally binding
With the Green Deal and the Climate Neutral Data Centre Pact, the EU is increasingly anchoring the PUE in regulation. For example, new locations in the Netherlands may only be approved with a PUE ≤ 1.2.
PUE as a strategic factor in management, ESG, and procurement PUE
The PUE is also gaining strategic importance from a stakeholder perspective. Operators use it as an operational control parameter and as a KPI (key performance indicator) in their energy management systems. Investors are integrating PUE values into ESG due diligence processes and financing models, such as green bonds. For customers, it is increasingly part of tender and certification criteria. Hyperscalers such as Google or Microsoft publish it as an integral part of their sustainability reports – and link their net-zero goals (decarbonisation by 2040/2050) to it.
PUE as a component of minimum regulatory standards
Relevant certificates such as EN 50600-4-2, ISO/IEC 30134-2, LEED (Leadership in Energy and Environmental Design), or the EU Code of Conduct for Data Centres anchor PUE limits as a minimum standard. A low PUE therefore not only improves the operating cost structure, but also the regulatory valuation and market value of a data centre. Efficiency becomes a licensing factor – ecologically, economically, and reputationally.
Factors influencing the PUE value
The PUE value is the result of a complex interplay of technical, infrastructural, and operational factors.
How cooling technology significantly influences PUE
Cooling is the largest infrastructural energy consumer in the data centre and therefore one of the central factors in reducing PUE. The more efficiently heat is dissipated, the lower the share of non-IT consumers in the total energy demand.
Classic air cooling – supported by free cooling or adiabatic evaporation systems – is widespread but reaches its physical and energetic limits as power density increases. Direct steam generation remains in use in older plants, but is significantly less efficient.
Liquid cooling, especially direct-to-chip liquid cooling (DLC), is considered to be trend-setting. The waste heat is dissipated directly at the processor surface by a circulating coolant. This significantly reduces the energy required for air conditioning while also enabling higher packing densities. Forecasts predict that DLC will become the leading cooling technology by 2030 - not only due to its thermal efficiency, but also because it is a prerequisite for low PUE values in AI and HPC environments. For operators who consistently align data centres with efficiency, it is a central component of future.
Other factors influencing the PUE
In addition to cooling technology, other technical and structural factors determine the PUE value of a data centre. In power distribution, the efficiency of the uninterruptible power supply (UPS) plays a central role. Modern online UPS systems achieve efficiencies of over 97%. Losses occur mainly in older transformers or in unnecessary conversion stages, which can be largely avoided by direct current distribution.
The building concept also has a measurable effect on energy efficiency. Consistent hot/cold aisle containment, short pipe lengths, and well-insulated sheaths minimise thermal losses. Modular construction methods also support needs-based scaling while maintaining a high level of space efficiency.
The location itself is another influencing factor. In cold and dry regions, the outdoor climate significantly reduces the cooling requirement – with correspondingly positive effects on the PUE. At the same time, high electricity prices and CO₂ intensities in the grid reinforce the ecological and economic benefits of any efficiency improvement.
The utilisation of IT infrastructure is not directly measured by PUE, but it has an indirect effect. When the server load is low, the energy demand of the infrastructure remains almost constant, while the useful energy decreases, deteriorating the PUE. Virtualisation, intelligent load balancing, and AI-based workload management can be used to increase IT utilisation in a targeted way, thereby improving PUE without replacing hardware.
Optimising PUE: Measures for more efficient data centres
A low Power Usage Effectiveness (PUE) does not result from individual measures, but from a systematic interplay of technical, infrastructural, and organisational decisions. If you want to set up data centres efficiently, you should consistently implement the following factors in new construction or modernisation.
- Modernise cooling technology
Air conditioning remains the dominant factor influencing PUE. Operators should rely on efficient systems such as hot aisle containment, adiabatic cooling, free outdoor air use, or direct-to-chip liquid cooling (DLC). DLC, in particular, enables low PUE values with increasing rack density and power-hungry workloads, such as AI and HPC.
2. Strategically integrating waste heat
If the waste heat from a data centre is fed into district heating networks close to the site, this does not improve the PUE, but it does improve the overall energy efficiency of the data centre. The EN 50600 standard maps this effect via the Energy Reuse Factor (ERF). Operators should consider technical return as an integral part of their ESG strategy, especially in urban environments.
3. Consolidate IT infrastructure
Low capacity utilisation leads to disproportionately high energy requirements. Virtualisation, consolidated workloads, and load shifting allow you to shut down unused resources without impacting compute performance. This indirectly lowers the PUE and reduces the base load of the supporting systems.
4. Automate monitoring
Energy efficiency cannot be controlled without transparency. Data centres should establish real-time PUE dashboards and AI-powered control systems for fans, UPS, and refrigeration systems. Studies show that automation reduces infrastructure consumption by up to ten percent – continuously and at scale.
5. Robustly design infrastructure
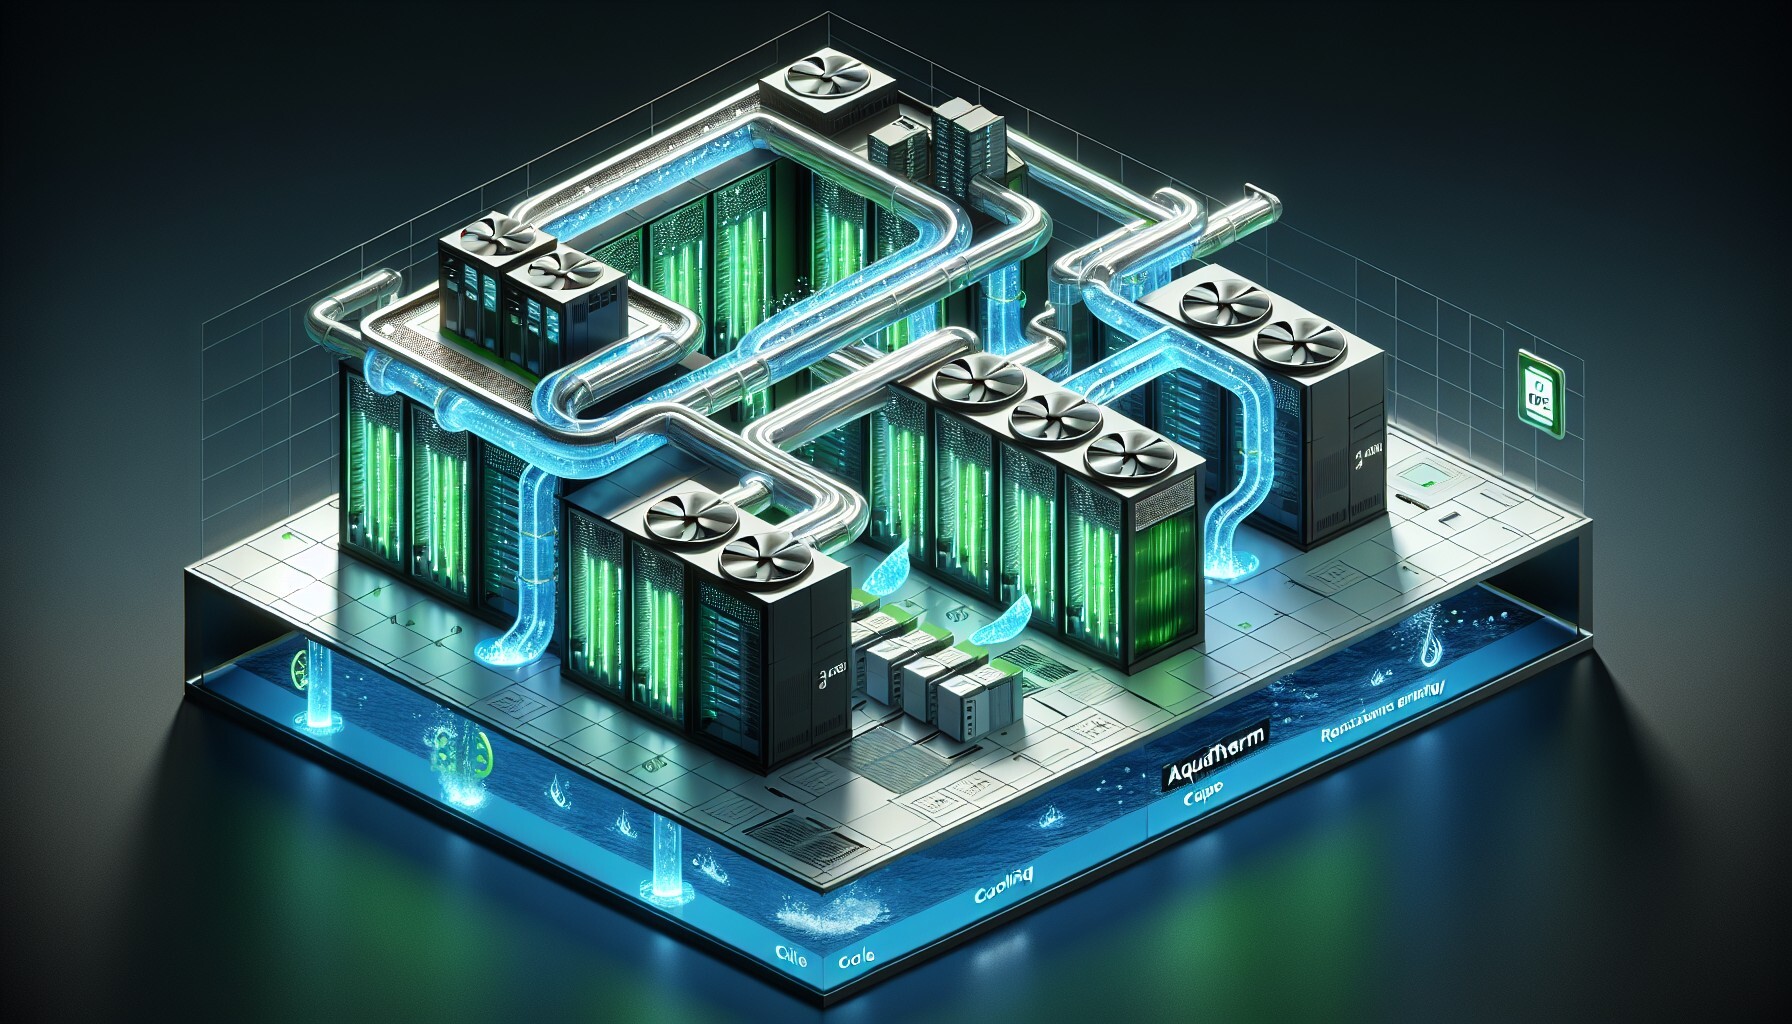
Liquid-based cooling systems require piping infrastructures that are low-maintenance, corrosion-free, and temperature-resistant. Systems such as aquatherm blue based on PP-RCT offer a long-term reliable solution here. The reference Novva Data Centre (USA) shows how high-quality infrastructure creates the technical basis for PUE target values below 1.24.
Where the PUE reaches its limits
The Power Usage Effectiveness (PUE) is a globally established benchmark for the infrastructural energy efficiency of data centres. It shows how much energy actually benefits IT and how much is spent on supporting systems such as cooling or power distribution. But its significance has clear limits.
First, the PUE does not measure the efficiency of IT itself. It ignores how much computing power is actually provided per kilowatt hour. Two data centres with identical PUE can perform completely differently – depending on the hardware generation, workload, or level of virtualisation.
Secondly, the PUE says nothing about the origin of the electricity. Whether fossil energy or green electricity is used is not taken into account. A data centre with very low PUE may have a worse carbon footprint than one with a higher PUE, depending on the energy mix used.
Third, the PUE can be influenced. The choice of measuring points, the exclusion of certain consumers or seasonal observation periods can result in a value that has little to do with the real overall efficiency.
Fourth: The PUE ignores conflicting goals. Higher redundancy levels in the data centre – for example according to Tier III or IV – structurally increase the energy requirement. More availability inevitably means less efficiency. Anyone who looks at the PUE in isolation ignores these strategic considerations.
So what to do? The PUE remains relevant as a technical benchmark. But it needs context. Supplementary metrics such as Carbon Usage Effectiveness (CUE), Water Usage Effectiveness (WUE) or Energy Reuse Factor (ERF) round off the picture. Only their combination allows a reliable statement to be made about the efficiency, sustainability, and future viability of a data centre. In short, the PUE is a start – not an end point.
Why Cooling is the Biggest PUE Opportunity
Cooling and air movement often guzzle 30–45% of a data centre’s energy. The shift toward direct-to-chip (DLC) liquid cooling for AI workloads (with racks at 50–120 kW) puts new pressure on all infrastructure — especially piping, which now becomes a persistent source of friction loss, inefficiency, and potential contamination.
The Stainless Steel Standard — And its Overlooked Downsides
304 stainless steel piping is the backbone of most DLC systems, chosen for low up-front cost, supply chain familiarity, strong pressure/temperature ratings, and regulatory approval worldwide.
But field and lab data tell a cautionary tale:
- Metal leaching: Independent fluid testing from multiple U.S. hyperscale sites found manganese at up to 25x EPA drinking water limits, plus magnesium and molybdenum — all traced directly to stainless steel piping.
- Corrosion under real conditions: Research in Nature Materials shows that in glycol coolants (25–50%), with pH 6.5–8.5 and flows up to 21 GPM — all standard for modern DLC — the pitting corrosion of 304 stainless is accelerated, bypassing traditional failure predictions.
- Result: Increased ion contamination forces frequent water treatment adjustments and shortens coolant life from the expected 7–10 years to just 3–5 in high-performance deployments.
The Real Cost of “Cheap” Infrastructure
Let’s run the numbers on a typical Ein typischer 3.785-litres-DLC loop over 10 years:
Stainless Steel System
Coolant replacement every 3–5 years: 66.000 EUR
Filter changes every 6–12 months: 17.500 EUR
Maintenance, testing, repairs: 52.500 EUR
Total: 136.000 EUR
Alternative Polymer System
Coolant replacement every 7–10 years: 26.500 EUR
Filter changes every 2–3 years: 1.800 EUR
Minimal maintenance: 2.800 EUR
Total: 31.100 EUR
Savings per 3785 litres over 10 years: 104900 EUR.
Scaling Cost to Data Centre Megawatts
DLC-cooled sites typically use 9.460 to 11.350 of coolant per MW. Here’s how that math scales up:
|
Facility IT Load
|
Coolant Volume
|
10-Year Stainless Steel Costs
|
10-Year Polymer Cost
|
Projected Savings
|
|
1 MW
|
9.460 – 11.350 l
|
339.000 – 409.000 EUR
|
78.000 – 94.000 EUR
|
262.000 – 315.000 EUR
|
|
10 MW
|
94.600 – 113.500 l
|
3,39 – 4,09 Mio. EUR
|
0,78 – 0,94 Mio. EUR
|
2,62 – 3,15 Mio. EUR
|
For a 10 MW site Für einen 10-MW-Standort (≈ 94,600 litres of coolant ) moving to non-corrosive piping can save 2.62 Mio. EUR in10 years — just on maintenance and replacement.
Conclusion
PUE is the industry’s efficiency yardstick, but real-world gains hinge on infrastructure that supports your OPEX and uptime goals — not just up-front savings.
Evidence shows that “cheap” piping often isn’t cheap at all: hidden contamination, higher filter spend, and earlier coolant replacement all add up. For operators committed to efficiency, it’s time to evaluate every aspect of your cooling loop — especially what’s inside your pipes.
Learn how an optimal PUE value can reduce both costs and environmental impact in our 20-page white paper:

If you want to redesign a data centre or operate it more efficiently with a modernisation, talk to us. Our team of experts at aquatherm supports you with sound advice, planning and design.

Important note: The information in this blog — especially regarding costs — refers to the year 2025.